Frequency analysis
From the main menu, select:
Plot → Frequency analysis. All
the selected data are sent
to this window (triangles of meshes are not yet included).
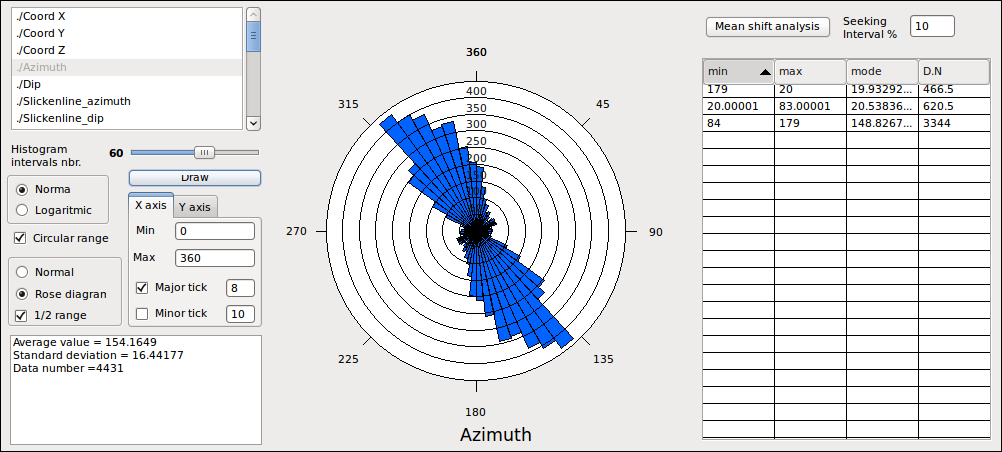
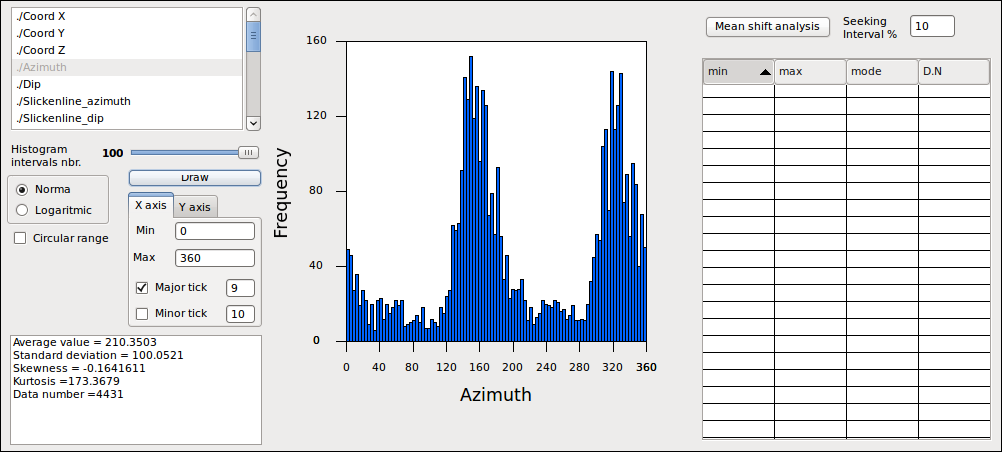 In
the list-box on top-left are listed all the Value fields. Select a
field and the corresponding histogram will be drawn. Statistical
attributes will be listed on the lower-left border of the window.
These include the average
value, the standard deviation, the skewness, the kurtosis, and data
number. In
the case of circular data, only the circular mean, the
circular standard deviation and the data number are displayed.
You can specify X and Y limits, if the data are logarithmic or
circular and, in this case, if you want to analyse the semi-circular
range. The number of intervals can be set by moving the slide-bar.
Data
can be saved as SVG (mouse right click), provided “SVG writing”
is
allowed in the in the drawing options (Main window File – >
Drawing Options).
The
clustering of the population can be analysed by means of the mean shift
analysis.
Input parameter is the seeking interval (which is a sort of smoothing radius),
expressed as a percentage of the X-interval. Results
of mean shift analysis are listed in the list-box on the right side
of the window and include,
for each sub-population, the boundaries, the mode and the data
number. These
can be copied and pasted in a spreadsheet by right-clicking the list-box
In
the list-box on top-left are listed all the Value fields. Select a
field and the corresponding histogram will be drawn. Statistical
attributes will be listed on the lower-left border of the window.
These include the average
value, the standard deviation, the skewness, the kurtosis, and data
number. In
the case of circular data, only the circular mean, the
circular standard deviation and the data number are displayed.
You can specify X and Y limits, if the data are logarithmic or
circular and, in this case, if you want to analyse the semi-circular
range. The number of intervals can be set by moving the slide-bar.
Data
can be saved as SVG (mouse right click), provided “SVG writing”
is
allowed in the in the drawing options (Main window File – >
Drawing Options).
The
clustering of the population can be analysed by means of the mean shift
analysis.
Input parameter is the seeking interval (which is a sort of smoothing radius),
expressed as a percentage of the X-interval. Results
of mean shift analysis are listed in the list-box on the right side
of the window and include,
for each sub-population, the boundaries, the mode and the data
number. These
can be copied and pasted in a spreadsheet by right-clicking the list-box
.