 |
 |
 |
| Menu |
| Pop-up menu |
| Stereoplot overlay |
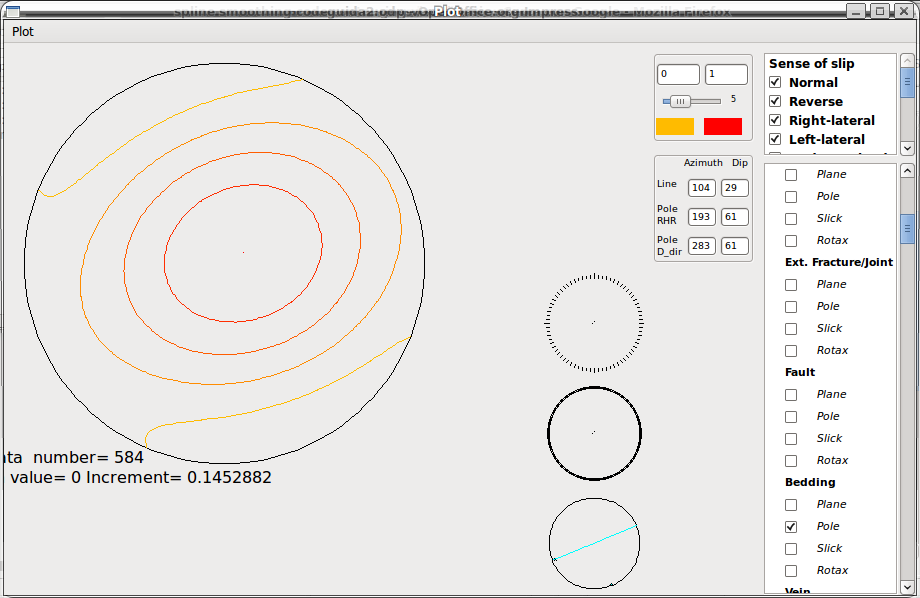
From the main menu, select: Plot → Stereoplot. All the selected data are sent to this window.
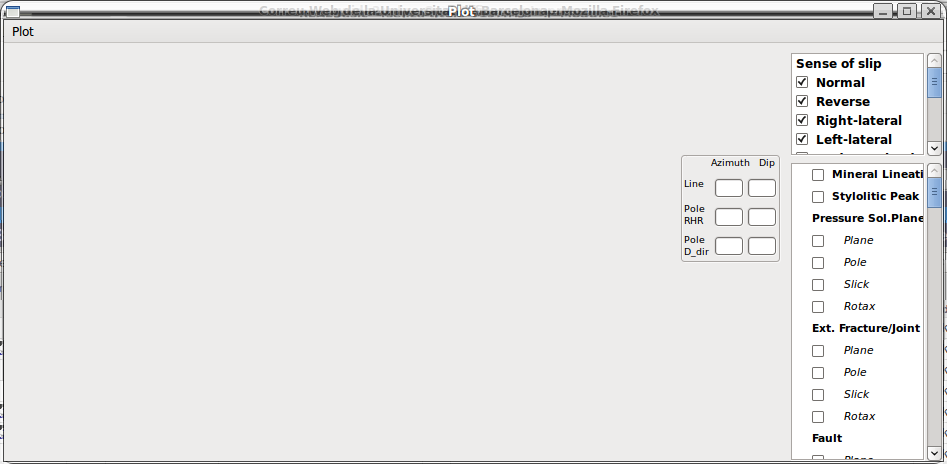
In the two list-boxes on the right you can select data according to their type and sense of slip, and can specify which attribute will be plotted for each element.
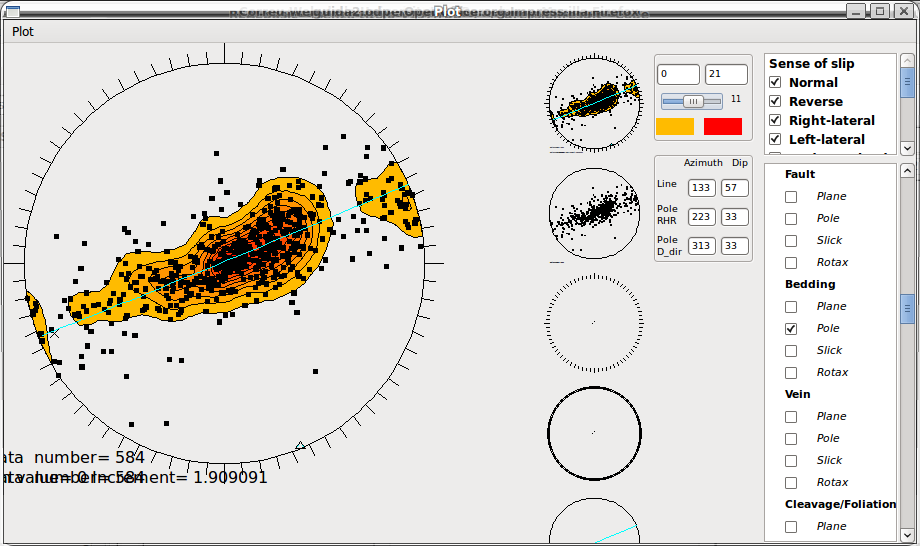
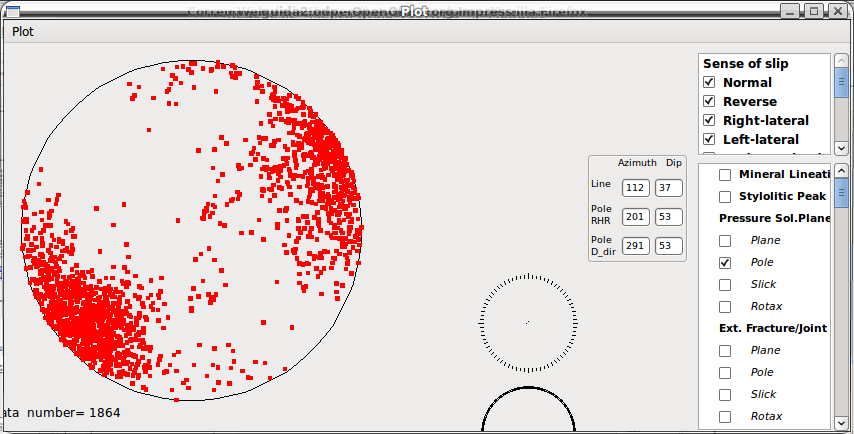
Plot → Stereoplot: Plot data in stereographic equal-area projection.
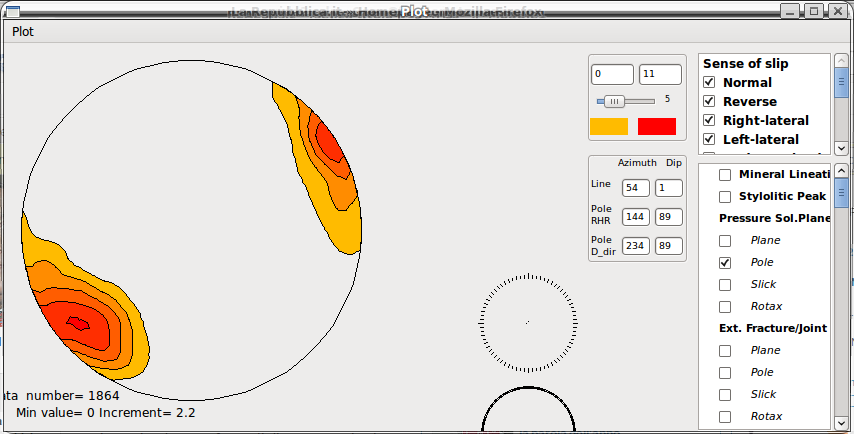
Plot → Contouring: Plot data contour in stereographic equal-area projection. Data contour can be computed using classical Kalsbeek method (Plot → Contouring → Kalsbeek) or using a Gaussian data smoothing procedure ( Plot → Contouring → Gaussian Smooth), which produces more “smoothed” contours. Fast Kalsbeek is designed for large dataset (i.e. from 10^4 to 10^7), but produces less accurate results.
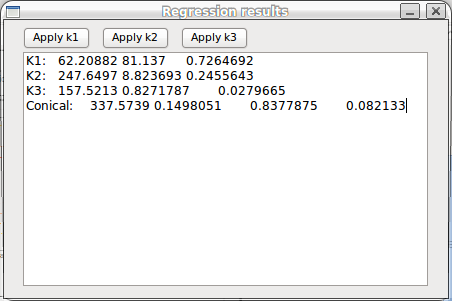
Plot → Data Regression: Applies a tensorial analysis and a conical regression to the selected data.
The Regression results are displayed in a new window. They include eigenvectors azimuth and dip and the corresponding eigenvalues, and cone axis azimuth, dip and conical angle. The three buttons in this window allow to assign azimuth and dip of a given eigenvector to the selected dataset (notice that in this case selected data includes not only the plotted one, but all the selected data). The aim of this is discussed in the 3D section.
Eigenvectors and conical regression are also displayed in a small stereoplot at the bottom of the window (See stereoplot overlay)
Plot → Fill contours: When this option is activated contours are filled.
Plot → Rotated data: When this option is activated data are projected in their rotated orientation. A rotation axis must be defined.
A pop-up menu appears when right clicking within the stereonet, displaying 4 or 6 options.
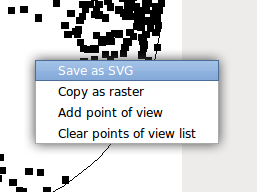
Save as SVG: Save the main stereoplot in Scalar Vector Graphics format. This is a vectorial format that can be read by the most part of Windows and Linux softwares for vectorial graphic. In order to save file as SVG, in the drawing options window (Main window → drawing Options) it must be checked the SVG writing option.
Copy as raster: Copies
the main stereonet as a raster image in the clipboard,
which can be pasted in drawing software.
Add point of
view: Stores
a direction (corresponding to the mouse position
within the stereonet). The
stored directions can be used in the 3D window and their purposes are
discussed later.
Notice that every time data regression is applied, the maximun and
minimum eigenvectors directions
are automatically stored.
Clear points of view list: Removes all the stored directions.
In the stereoplot window can be also selected a sub-portion of the dataset. From the menu select: Draw selection → activate selection drawing. Draw a selection containing data you want to select and then right-click with the mouse.
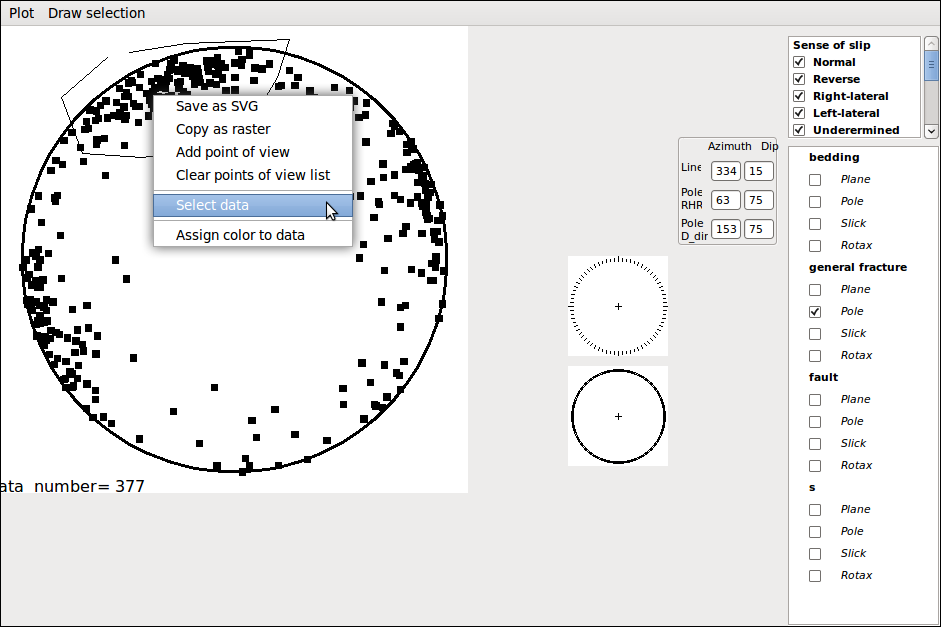
3 new options are displayed in the pop-up menu:
Select data: (see function in data selection section)
Create new sub-set: assign a new sub set value to the selected data.